
EnergyLink App para mostrar información del mercado y resultados de las operaciones
 Torkel Ödegaard
5a3d3f5098
updated build and release tasks
Torkel Ödegaard
5a3d3f5098
updated build and release tasks
|
11 years ago | |
|---|---|---|
| sample | 11 years ago | |
| src | 11 years ago | |
| tasks | 11 years ago | |
| .gitignore | 11 years ago | |
| .jscs.json | 11 years ago | |
| .jsfmtrc | 11 years ago | |
| .jshintrc | 11 years ago | |
| .travis.yml | 11 years ago | |
| CHANGELOG.md | 11 years ago | |
| CONTRIBUTING.md | 12 years ago | |
| Gruntfile.js | 11 years ago | |
| LICENSE.md | 12 years ago | |
| NOTICE.md | 12 years ago | |
| README.md | 11 years ago | |
| latest.json | 11 years ago | |
| package.json | 11 years ago |
README.md
Grafana 

![Gitter]()
Website | Twitter | IRC | Email
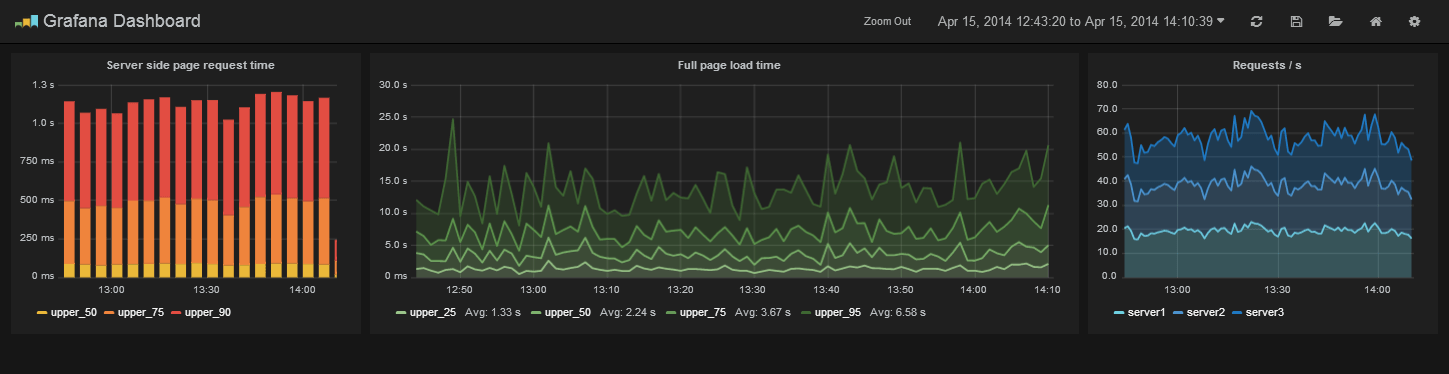
Grafana is An open source, feature rich metrics dashboard and graph editor for Graphite, InfluxDB & OpenTSDB.
Features
Graphite Target Editor
- Graphite target expression parser
- Feature rich query composer
- Quickly add and edit functions & parameters
- Templated queries
- See it in action
Graphing
- Fast rendering, even over large timespans.
- Click and drag to zoom.
- Multiple Y-axis.
- Bars, Lines, Points.
- Smart Y-axis formating
- Series toggles & color selector
- Legend values, and formating options
- Grid thresholds, axis labels
- Annotations
Dashboards
- Create, edit, save & search dashboards
- Change column spans and row heights
- Drag and drop panels to rearrange
- Use InfluxDB or Elasticsearch as dashboard storage
- Import & export dashboard (json file)
- Import dashboard from Graphite
- Templating
- Scripted dashboards
- Dashboard playlists
- Time range controls
InfluxDB
- Use InfluxDB as a metric data source, annotation source and for dashboard storage
- Query editor with series and column typeahead, easy group by and function selection
OpenTSDB
- Use as metric data source
- Query editor with metric name typeahead and tag filtering
Requirements
There are no dependencies, Grafana is a client side application that runs in your browser. It only needs a time series store where it can fetch metrics. If you use InfluxDB Grafana can use it to store dashboards. If you use Graphite or OpenTSDB you can use Elasticsearch to store dashboards or just use json files stored on disk.
Installation
Head to grafana.org and download the latest release.
Then follow the quick setup & config guide. If you have any problems please read the troubleshooting guide.
Documentation & Support
Be sure to read the getting started guide and the other feature guides.
Run from master
Grafana uses nodejs and grunt for asset management (css & javascript), unit test runner and javascript syntax verification.
- clone repository
- install nodejs
- npm install (in project root)
- npm install -g grunt-cli
- grunt (runt default task that will generate css files)
- grunt build (creates optimized & minified release)
- grunt release (same as grunt build but will also create tar & zip package)
- grunt test (executes jshint and unit tests)
Contribute
If you have any idea for an improvement or found a bug do not hesitate to open an issue. And if you have time clone this repo and submit a pull request and help me make Grafana the kickass metrics & devops dashboard we all dream about!
Before creating a pull request be sure that "grunt test" runs without any style or unit test errors, also please sign the CLA
License
Grafana is distributed under Apache 2.0 License.